Heatwave Event and Non-Heatwave Event Sampling Flowchart Automated Identification, Data Collection, and Monitoring Protocol
Bwire, C ; Juel, R; Hughes, R; Yeung, S; Bonell, A and Milner, J
(2025).
Heatwave Event and Non-Heatwave Event Sampling Flowchart Automated Identification, Data Collection, and Monitoring Protocol.
[Dataset].
London School of Hygiene & Tropical Medicine, London, United Kingdom.
10.17037/DATA.00004616.
; Juel, R; Hughes, R; Yeung, S; Bonell, A and Milner, J
(2025).
Heatwave Event and Non-Heatwave Event Sampling Flowchart Automated Identification, Data Collection, and Monitoring Protocol.
[Dataset].
London School of Hygiene & Tropical Medicine, London, United Kingdom.
10.17037/DATA.00004616.
; Juel, R; Hughes, R; Yeung, S; Bonell, A and Milner, J
(2025).
Heatwave Event and Non-Heatwave Event Sampling Flowchart Automated Identification, Data Collection, and Monitoring Protocol.
[Dataset].
London School of Hygiene & Tropical Medicine, London, United Kingdom.
10.17037/DATA.00004616.
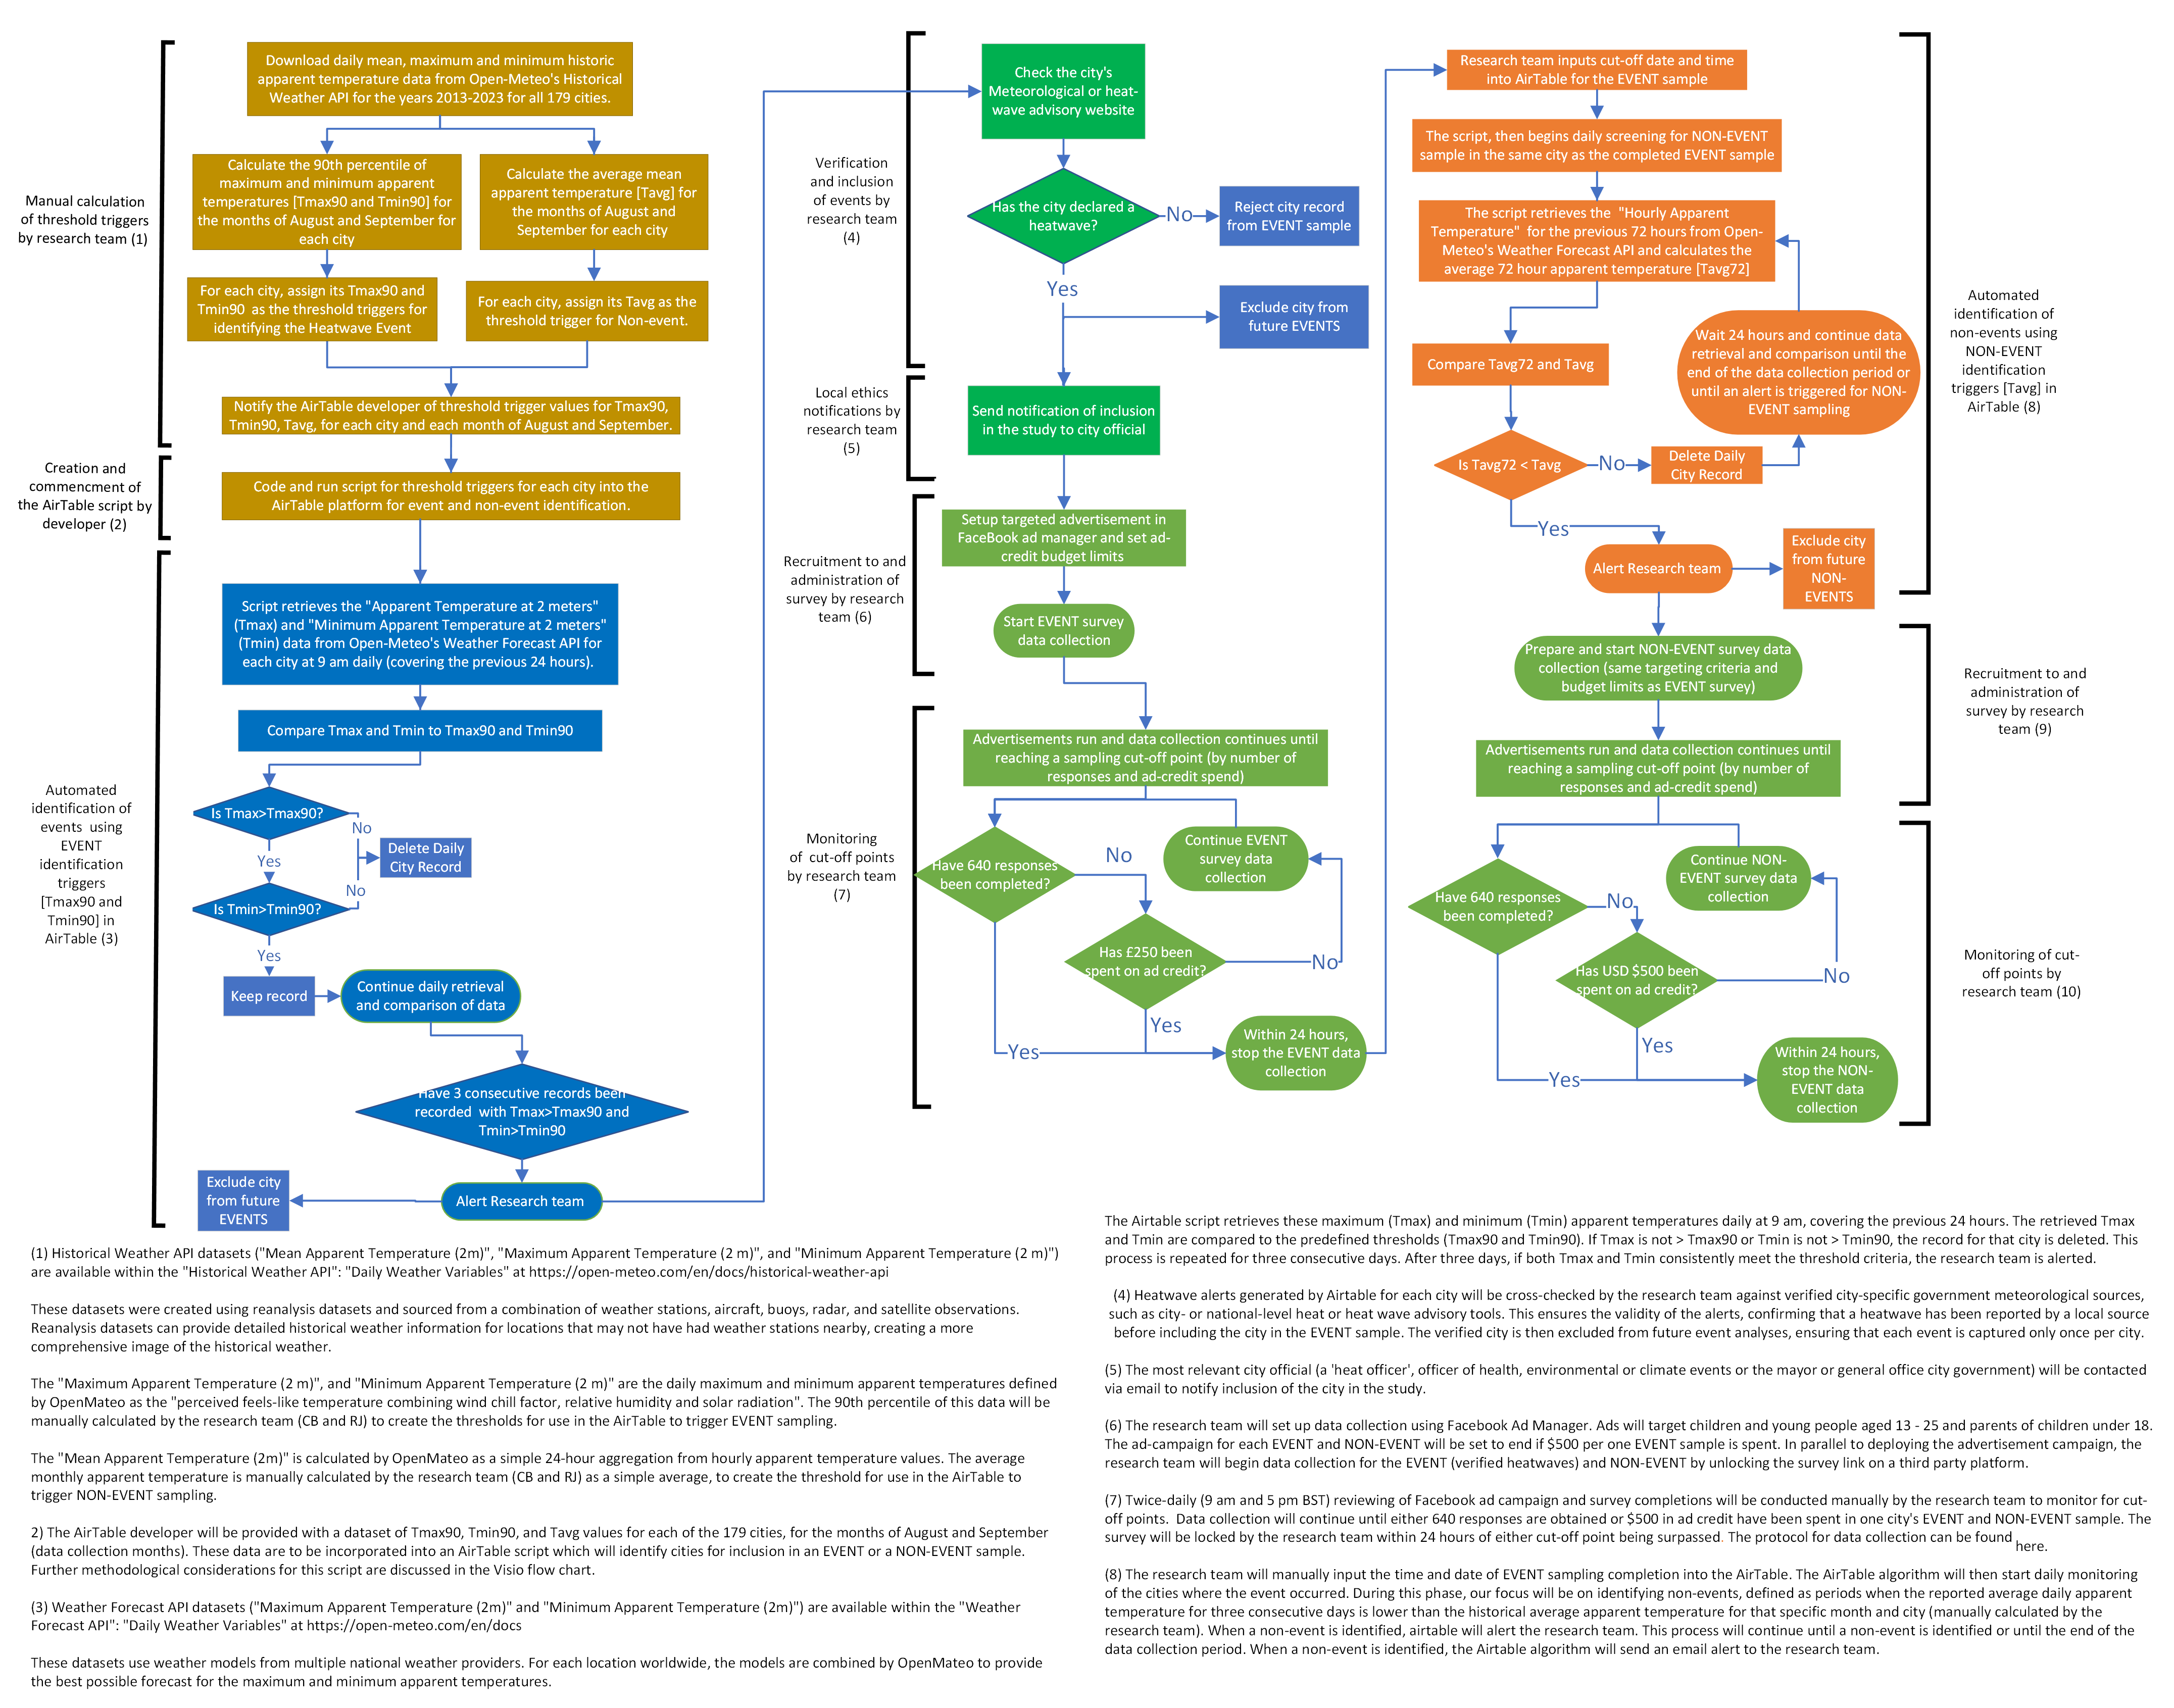
This flowchart visualizes the comprehensive process of sampling data during heat events and non-event periods. The workflow is designed to automate the identification of heatwave events, collect relevant data efficiently, and monitor progress throughout the study. The workflow is divided into three primary sections: manual calculation and trigger creation, automated event identification, and data collection with monitoring.
Keywords
Workflow; Heatwave Identification| Item Type | Dataset |
|---|---|
| Resource Type |
Resource Type Resource Description Workflow Research tool |
| Description of data capture | The data capture method for the heatwave impact study involves systematically collecting data to understand how heatwaves affect the health, well-being, and daily activities of children, young people, and parents (CYPP) in urban environments. The study targets 179 cities worldwide (the ActionLab's focal cities) |
| Capture method | Questionnaire: Fixed form - Web-based |
| Collection Period |
From To 1 September 2024 15 March 2025 |
| Date | 22 March 2025 |
| Language(s) of written materials | English |
| Creator(s) |
Bwire, C; Juel, R; Hughes, R; Yeung, S; Bonell, A and Milner, J
|
| Associated roles | Bwire, C (Researcher); Hughes, R (Principal Investigator) and Juel, R (Researcher) |
| LSHTM Faculty/Department |
Faculty of Epidemiology and Population Health > Dept of Population Health (2012- ) Faculty of Infectious and Tropical Diseases > Dept of Clinical Research Faculty of Public Health and Policy > Dept of Global Health and Development Faculty of Public Health and Policy > Dept of Public Health, Environments and Society MRC Unit The Gambia at LSHTM |
| Research Centre | Centre on Climate Change and Planetary Health |
| Research Group | Children & Young People, Cities and Climate (CCC) Action Lab |
| Participating Institutions | London School of Hygiene & Tropical Medicine, London, United Kingdom |
| Funders |
Project Funder Grant Number Funder URI Children & Young People, Cities and Climate (CCC) Action Lab 101913EH10 https://doi.org/10.13039/501100011318 |
| Date Deposited | 07 Apr 2025 16:24 |
| Last Modified | 23 Jun 2026 13:21 |
| Publisher | London School of Hygiene & Tropical Medicine |
Data Visualisation
CCC_Heat_Event_sampling-Phase3-5.png
-
subject - Graphical representation of data
-

- Available under Creative Commons: Attribution 4.0
-
info - CCC Heat Event sampling flow chart - Phase 3-5
image - image/png
- folder_info
- 973kB
Downloads